
Understanding the dashboard: monitoring, open hits and quota
After signing in you land on the dashboard – your control center for sanctions list screening. At a glance it shows you how many records are being monitored, whether there are still unrated hits, and how much of your quota is used. This article explains how to read the tiles and the module block.
Step by step
- Sign in. At the top you see the greeting “Welcome to the Customer Portal” and below it the note “Your control center for sanctions list screening.”.
- Right below are the tiles, arranged in three groups. Each enabled module (sanctions lists, PEP, Dow Jones) has its own tile in every group.
- “Records in Monitoring” group: the large number per module is the count of records currently being monitored. Clicking the number takes you to that module’s monitoring list.
- “Open Hits (not yet rated)” group: the number shows how many of this module’s hits are still unrated, labelled “unrated hits”. If it is greater than 0, the number is red with a warning triangle and is clickable – it takes you straight to the assessment. At 0 a green shield icon is shown instead.
- “Quota Utilization” group: here you see, per module, used / maximum records, the percentage next to it, and a progress bar below. The bar is green at normal usage, amber from 80 % and red at 100 %. Below it is the label “Checks used / Quota”.
- Under the tiles comes the “Your Active Modules” block: it lists the modules and data sources active in your plan, including the date of the last update.
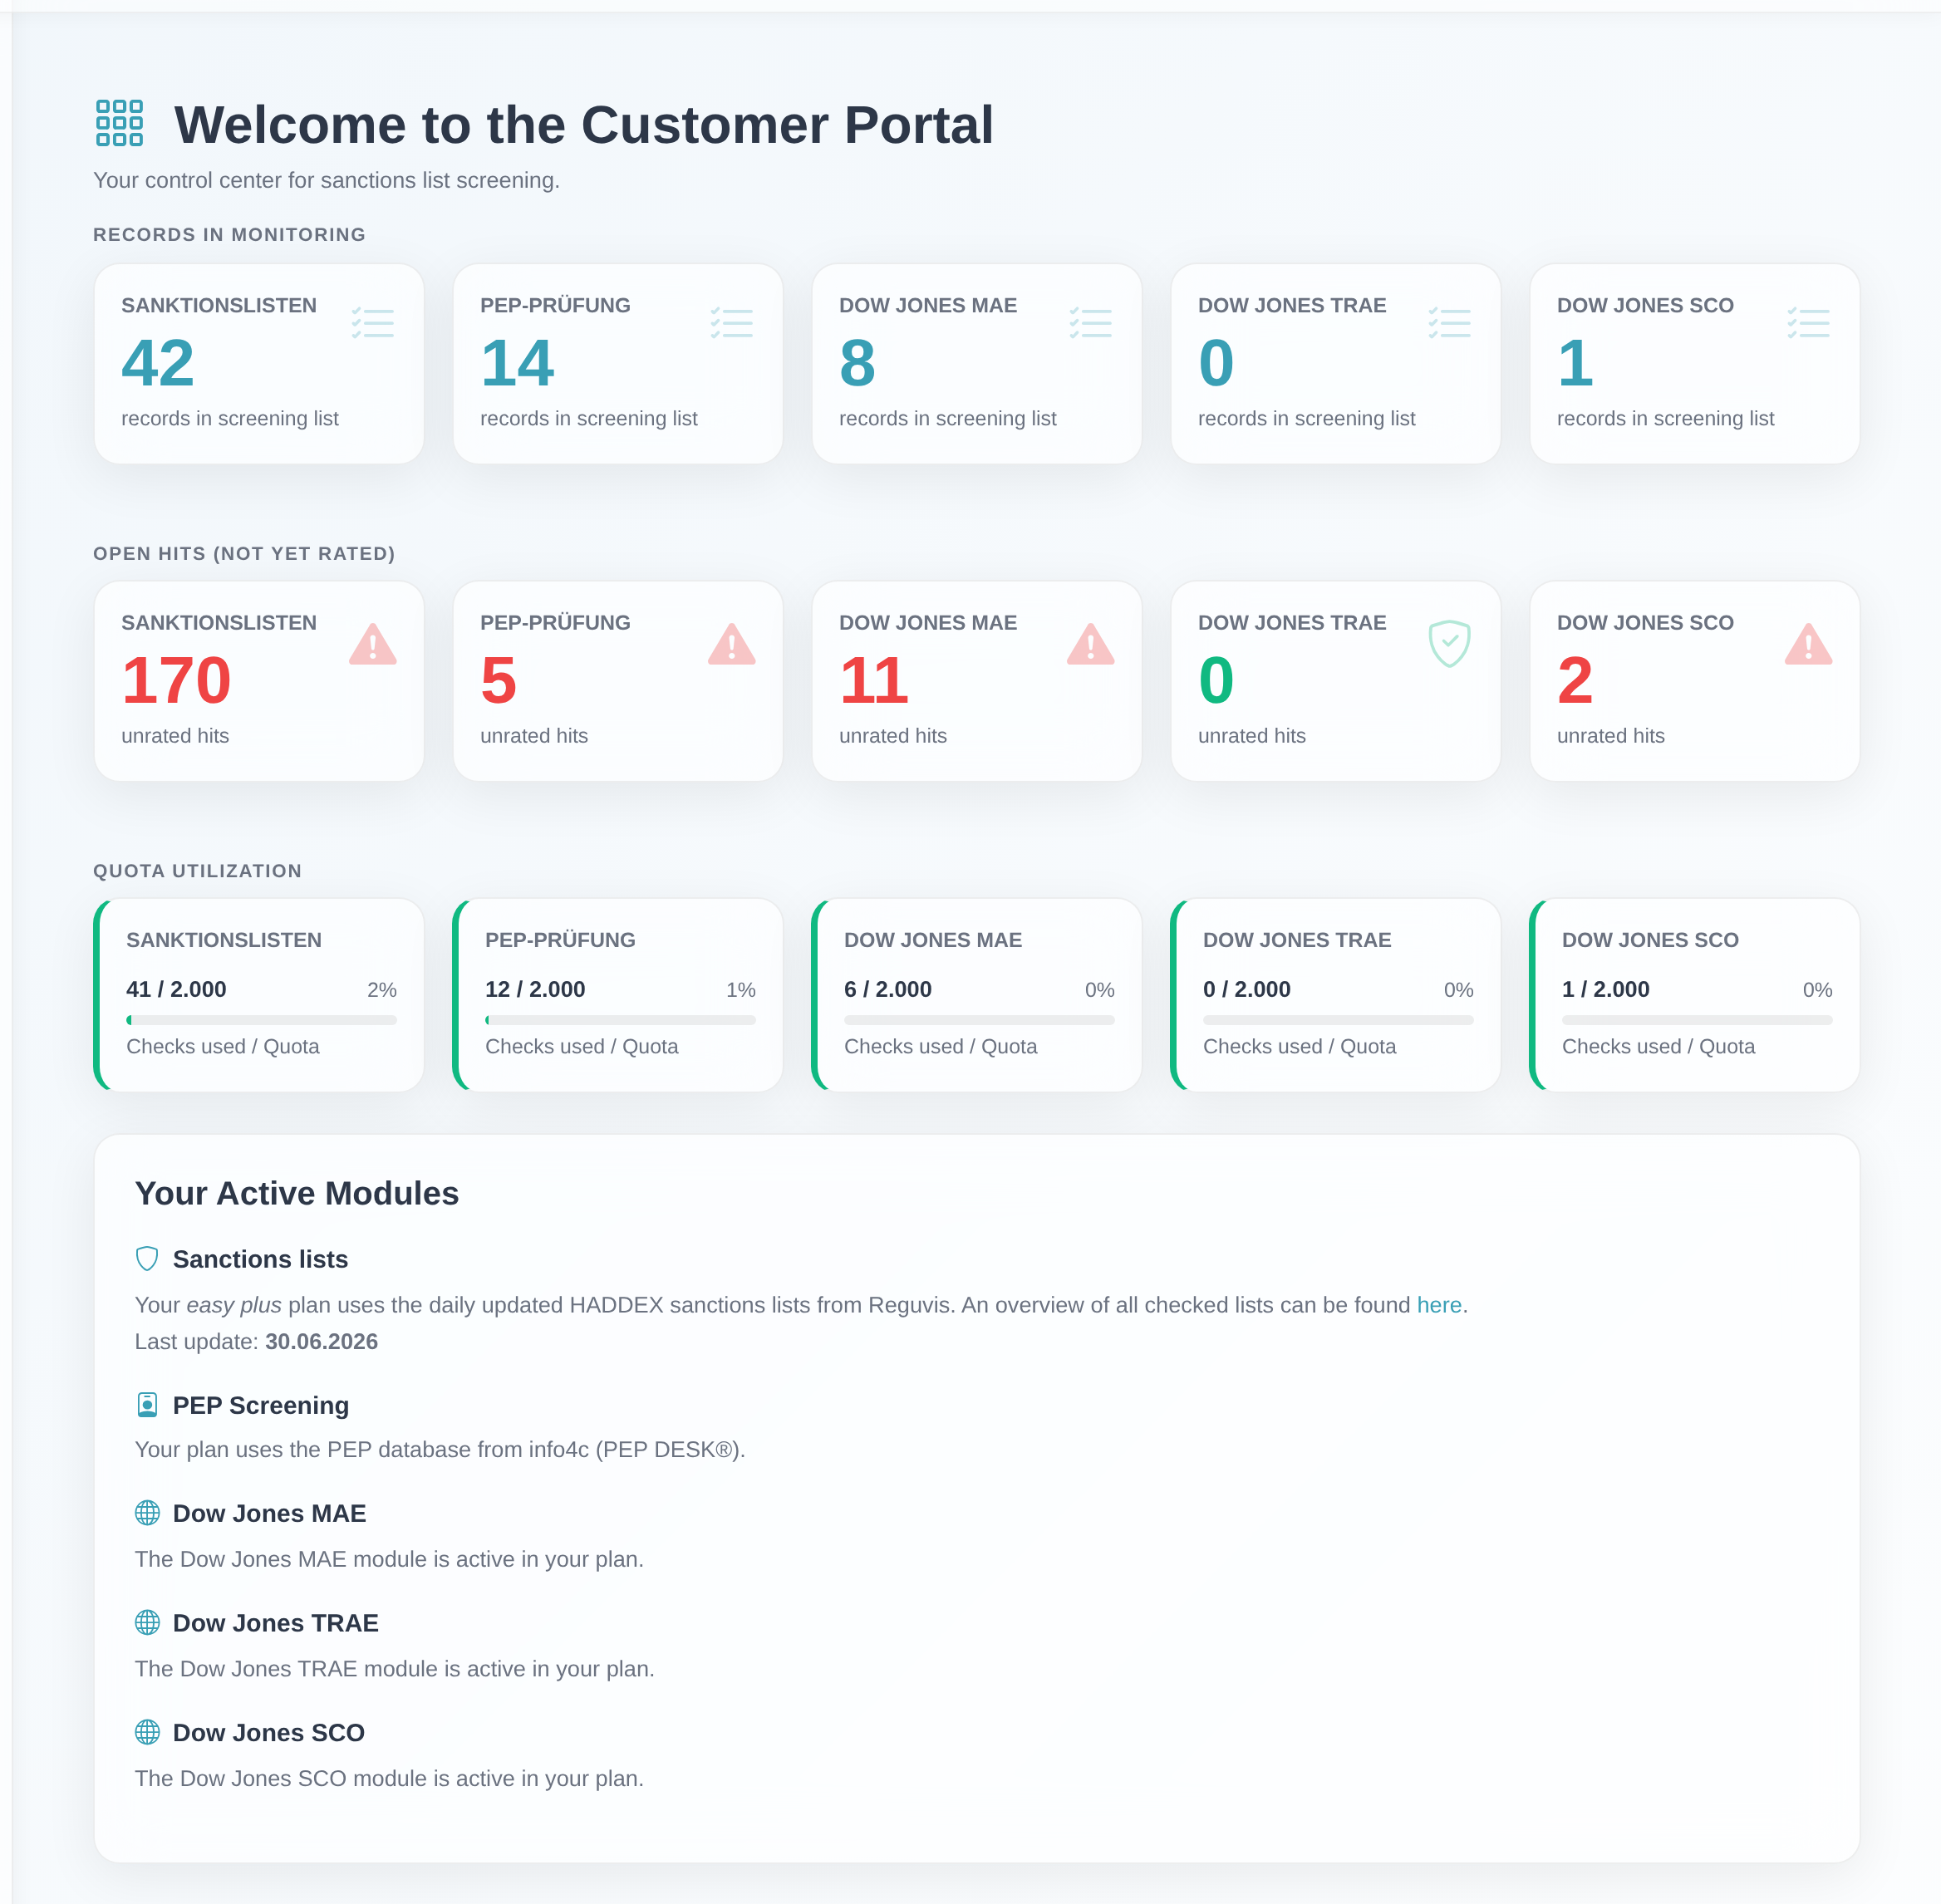 The dashboard with the greeting, the three tile groups per module and the “Your Active Modules” block.
Good to know
- Three tile groups, one tile per module:
- “Records in Monitoring” – the records of the module that are currently monitored. The number links to the monitoring list.
- “Open Hits (not yet rated)” – the module’s unrated hits. A red number with a warning triangle means action is needed and the click leads to the assessment; a green shield means nothing is open.
- “Quota Utilization” – used/maximum records with a percentage bar. The bar changes colour at high usage (amber from 80 %, red at 100 %). If an ∞ symbol appears instead of a maximum, no fixed limit is set.
- “Your Active Modules”: depending on your plan, this lists, for example, sanctions lists (with the lists in use and the date of the last update), PEP screening, and the Dow Jones modules MAE, TRAE and SCO. Each entry briefly names its data source.
- Only enabled modules appear: a tile or module entry is shown only if the module is enabled in your plan and your access is permitted to use it. If you lack permission to view a monitoring list, the corresponding tile stays hidden.
- Test accounts: in test mode, only the EU sanctions list individual check is available. The “Your Active Modules” block points this out: “You are using a test access. In test mode, only the EU sanctions list individual check is available.”
- Navigating from the tiles: the monitoring number takes you to the monitoring list, and the hit number (when greater than 0) takes you to the hit assessment of the respective module.
- Additional “API quota” tile (only with API access): if your account has API access, the “API quota” tile additionally appears, showing the monthly usage per API type and the “View API statistics →” link. Without API access it is not shown. How to view usage and quotas in detail is explained in the article “Viewing API usage and quotas (API statistics)” in category 9 – Integrations & ordering.
- “Last login” in the header: open the user menu at the top right and, below your customer number, it shows the “Last login” entry – the time of your previous successful sign-in. This lets you quickly tell whether someone unauthorized has signed in with your access.
- Further settings (account data, password, search options, two-factor authentication) are further down the same page in the “Settings & Account Data” area.
Frequently asked questions
What does the large number on the “Records in Monitoring” tile mean? It is the count of records of that module currently being monitored. Clicking the number opens the module’s monitoring list.
Why is the hit number red with a warning triangle? The “Open Hits (not yet rated)” tile turns red with a warning triangle as soon as there is at least one unrated hit. Click the number to assess the hits. If it shows 0 with a green shield, nothing is open.
What does the bar on the “Quota Utilization” tile tell me? It shows the ratio of used to maximum records (used / maximum) as a percentage bar. It turns amber from 80 % and red at 100 %, so you can tell early when your quota is running low.
Why do I only see the EU sanctions lists and no other tiles? You are probably using a test access. In test mode, only the EU sanctions list individual check is available; further modules appear only with a regular plan.
A tile or module is missing – why? Tiles and modules appear only when the module is enabled in your plan and your access is permitted to use it. Without the permission to view a module’s monitoring list, its tile stays hidden. If in doubt, contact our customer service.
Requirements
- A valid login for the easycompliance customer portal (see Signing in to the customer portal).
- Which tiles and modules appear depends on your plan and your permissions. Test accounts see only the EU sanctions lists.
Related articles
- Signing in to the customer portal
- What is monitoring – reading the overview
- Rating a hit as false positive or positive
Last reviewed: